EARTH & ENVIRONMENTAL SCIENCE - ECOLOGICAL FOOTPRINT

Ecological Footprint Worksheet

  • 10 questions
  • Difficulty: Hard
  • Board: USCC
  • Attempt online on the examination portal

Here are the first 3 questions. Click “View all questions” to see the complete assessment.

Q1.

A city's population is currently 200,000, and its average ecological footprint is 4.0 global hectares (gha) per person. A forecast shows a population of 250,000 and an average footprint of 3.5 gha per person. Which claim is best supported by these data?

  1. A) The total footprint will increase by about 9.4%, so the per-person decrease will not fully offset population growth.
  2. B) The total footprint will decrease by 12.5% because consumption per person decreases.
  3. C) The total footprint will remain unchanged because population growth and reduced consumption cancel each other.
  4. D) The total footprint will increase by 25% because only population affects the total footprint.

Q2.

A county is comparing four forecasts for population and consumption per person. Which forecast would reduce the county's total ecological footprint and therefore most likely reduce its demand for land, energy, and natural resources?

  1. A) Plan D: population rises 15% and footprint per person falls 12%, producing a 1.2% total decrease.
  2. B) Plan B: population rises 18% and footprint per person falls 20%, producing a 5.6% total decrease.
  3. C) Plan C: population rises 6% and footprint per person falls 4%, producing a 1.76% total decrease.
  4. D) Plan A: population rises 12% and footprint per person falls 8%, producing a 3.04% total decrease.

Q3.

A district of 50,000 people has a food footprint of 1.6 gha per person. High-impact foods make up 40% of this footprint. A program replaces half of those high-impact foods with alternatives that have one-quarter of their footprint. If the population then grows by 10%, which result is expected?

  1. A) The food footprint becomes 88,000 gha because the change in food choices has no effect.
  2. B) The food footprint becomes 61,600 gha, a 23% decrease from the original total.
  3. C) The food footprint becomes 68,000 gha because population growth does not affect food demand.
  4. D) The food footprint becomes 74,800 gha, about 6.5% below the original total.

Q4.

A town of 80,000 people uses an average of 150 liters of treated water per person each day. Over ten years, its population is expected to grow by 10%, while conservation equipment is expected to reduce use per person by 20%. Which prediction best describes the effect on the freshwater system and the energy used for water treatment?

  1. A) Total use will fall by 12%, reducing pressure on freshwater supplies and treatment energy.
  2. B) Total use will remain the same because the two percentage changes are equal.
  3. C) Total use will fall by 20% because population size does not affect water demand.
  4. D) Total use will rise by 10%, increasing pressure on both systems.

Q5.

Regions A and B begin with equal total ecological footprints. In Region A, population doubles while consumption per person falls by 30%. In Region B, population rises by 20% while consumption per person rises by 10%. Which argument correctly compares their future impacts?

  1. A) Both regions will have the same increase because each experiences one change that raises demand.
  2. B) Region B will have the larger increase because any rise in consumption per person matters more than population growth.
  3. C) Region A will have the larger increase because its total footprint rises by 40%, compared with 32% in Region B.
  4. D) Region A's total footprint will fall by 30% because lower consumption per person fully determines total impact.

Q6.

An island has 120,000 gha of renewable biological capacity. Its 30,000 residents currently use an average of 3.0 gha per person. A development forecast predicts that population will rise by 25% and consumption per person will rise by 20%. What conclusion is supported by the forecast?

  1. A) Demand will be 112,500 gha, so the island will remain within its capacity.
  2. B) Demand will be 135,000 gha, exceeding capacity by 15,000 gha.
  3. C) Demand will be 150,000 gha, exceeding capacity by 30,000 gha.
  4. D) Demand will be 108,000 gha, leaving a reserve of 12,000 gha.

Q7.

A region has 120,000 people. Each person owns an average of two electronic devices, and each device is replaced every two years. A proposed reuse program is expected to coincide with population growth to 132,000 people, reduce ownership to 1.5 devices per person, and extend replacement time to three years. Which claim about annual device purchases is best supported?

  1. A) Annual purchases will rise by 10% because the population increases by 10%.
  2. B) Annual purchases will remain at 120,000 because greater population exactly offsets reuse.
  3. C) Annual purchases will fall from 120,000 to 66,000, reducing demand for mined materials and the production of electronic waste.
  4. D) Annual purchases will fall from 240,000 to 198,000 because replacement time does not affect consumption.

Q8.

A school district wants to recommend the project that produces the greatest annual reduction in its community's carbon footprint. A transportation project would help 3,000 commuters reduce emissions by 0.8 metric ton of carbon dioxide equivalent each. A home-energy project would help 8,000 households save 0.25 metric ton each. A food project would help 15,000 residents save 0.12 metric ton each. A tree project would remove 1,900 metric tons in total. Which recommendation is best supported?

  1. A) Choose the home-energy project because its total annual reduction is 8,000 metric tons.
  2. B) Choose the food project because reaching the most people always creates the largest total reduction.
  3. C) Choose the tree project because 1,900 metric tons is greater than the reductions from all other projects.
  4. D) Choose the transportation project because its total annual reduction is 2,400 metric tons.

Q9.

Use the population and ecological-footprint graphs. To prevent the city's total footprint in 2030 from exceeding its 2010 total, what additional change should the city achieve by 2030?
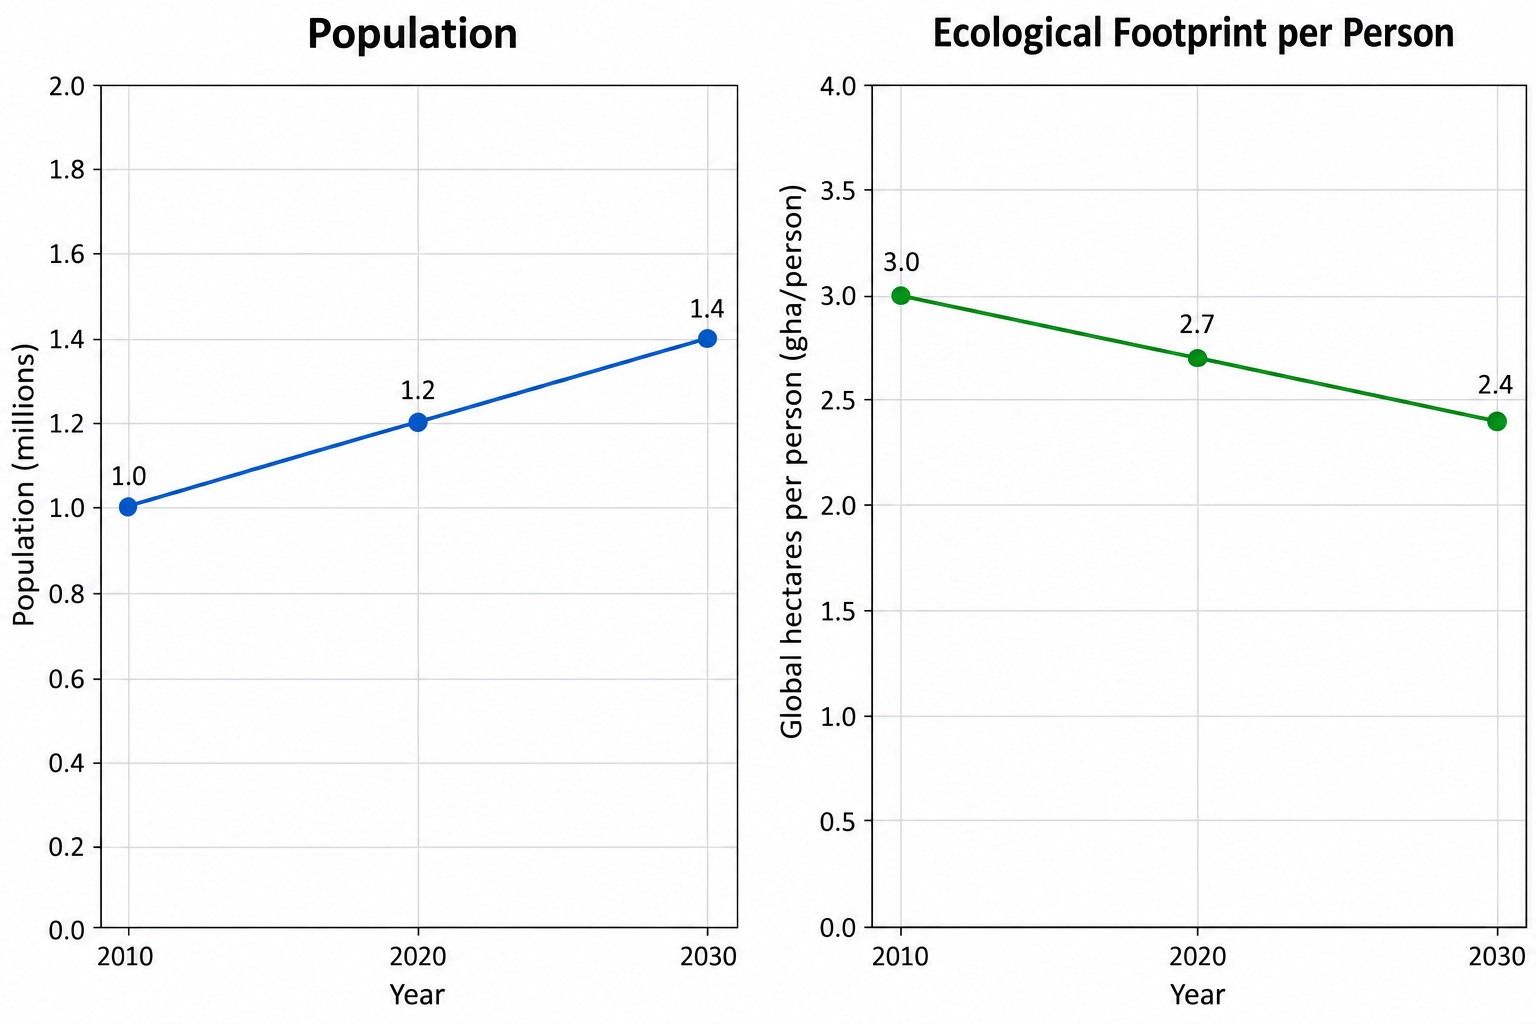
Diagram for question 9: Use the population and ecological-footprint graphs. To prevent the city's total footprint in 2030 from…
  1. A) Allow the footprint to rise from 2.4 to 2.7 gha per person.
  2. B) Reduce the projected footprint from 2.4 to 2.30 gha per person.
  3. C) Keep the projected footprint at 2.4 gha per person because it is below the 2010 rate.
  4. D) Reduce the projected footprint from 2.4 to about 2.14 gha per person or lower.

Q10.

The figure shows population and per-person ecological-footprint components for four neighborhoods. A transportation program can reduce the transportation component by 25% in one neighborhood. In which neighborhood would the program produce the greatest total reduction?
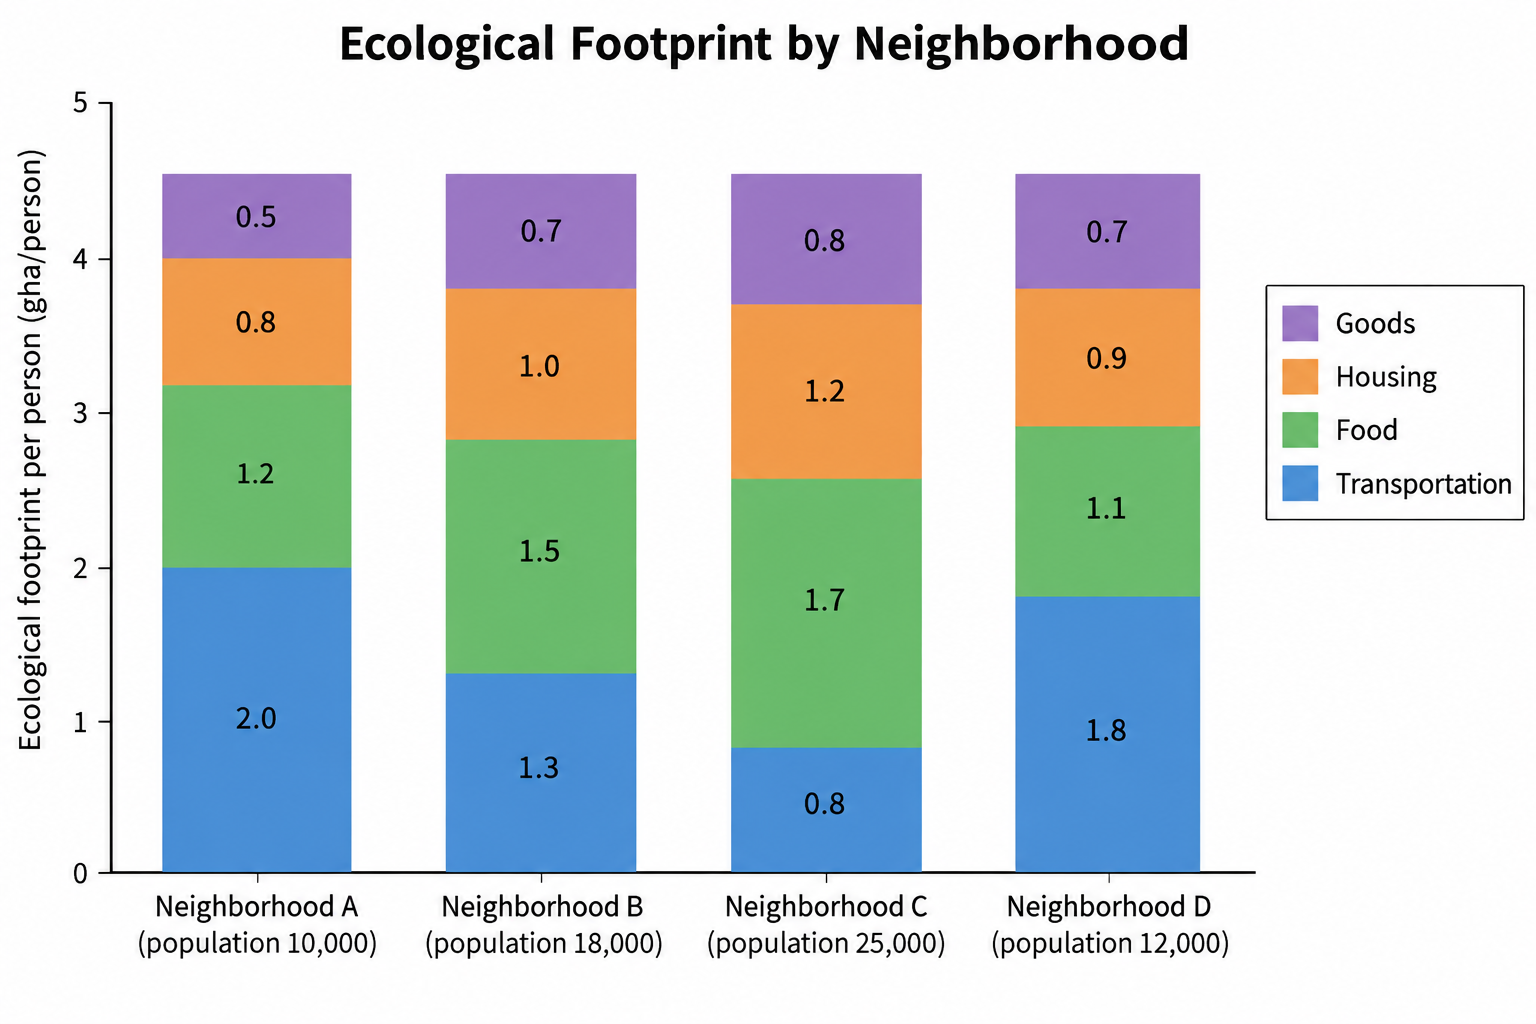
Diagram for question 10: The figure shows population and per-person ecological-footprint components for four neighborhoods. A…
  1. A) Neighborhood C, with a reduction of 5,000 gha
  2. B) Neighborhood B, with a reduction of 5,850 gha
  3. C) Neighborhood A, with a reduction of 5,000 gha
  4. D) Neighborhood D, with a reduction of 5,400 gha

What this assessment covers

Concepts Tested

  • ecological footprint

Question Mix

  • Hard questions included

Skills you build

  • Apply